Every day we hear more about how data is influencing our world and affecting critical decisions. Data-driven . Whether it be large scale policy decisions that will affect us as a nation or smaller personal choices like who to start on your fantasy football team, using data analytics to understand trends and potential different outcomes help us make informed choices.
The Foundations for Evidence-Based Policymaking Act of 2018 created an initiative for Federal government agencies to modernize data capabilities to promote data-driven decision making. While data can make our lives easier, not all of us have the ability to derive insights from large amounts of raw data. Too much data can create information overload, deterring good decision making. To support our government clients, we have the responsibility to create intuitive interfaces that make interacting with and manipulating data less imposing.
To accomplish this goal, we follow an iterative Human Centered Design (HCD) process to help identify and engage with the end users of the curated data.
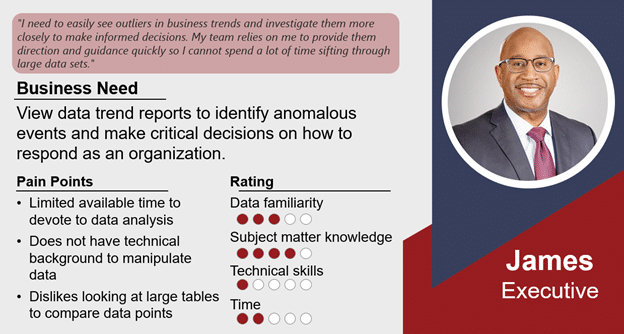
As we learn about the needs of our , we create different personas. A Persona is a representation of the wants, needs, and goals of the target user. Personas allow us to categorize and prioritize feature requirements based upon how many users they serve. By gaining an intimate understanding of the knowledge level and technical skills of the intended end users, we can empathize with the data consumers and create interfaces that present actionable insights tailored to their needs.
For example, a key persona may be “Executives.” Executives require a high-level view of trends within a data set and the ability to investigate anomalies to support critical decision-making. This user type typically does not have the time or technical skillset to identify tables and perform queries to find the needed data insights but do understand the data’s subject matter. Analysis of this persona allows us to create an interactive graphical dashboard for the “Executive” to display data in easy to decipher charts and the ability to drilldown into anomalous trends. Further engagement with this persona group can show more diverse needs for the types of data points that influence decisions. With this information, we can further derive requirements to allow for customizations of the dashboard by individual users.
Our design decisions are validated through continuous engagement with end users. We consolidate information learned about the project and user needs to ideate potential solutions. Ideas become hypotheses by creating journey maps, story boards, wireframes, and other design activities. Hypotheses are tested with interactive prototypes, empowering users to provide input. This iterative loop of creative problem solving through identifying needs, brainstorming solutions, building artifacts, validation testing, and user feedback drives innovation in the created data products.
To provide end users with the best data experience, employing a cross functional team with the skills to manage, analyze, and display large data sets as insights is a must. Analytica’s team are structured to place equal value on data engineers, data scientists, Business Intelligence (BI) application developers and User Experience Designers. The synergy of these SMEs balances getting the most out of the available data with ensuring the end users understand the message the data is telling. In coordination with our government partners, we define requirements and choose the best platform for the solution, whether that be a BI tool or a custom developed application. As our data experts identify insights, we create initial interfaces and employ HCD process to refine the presentation layer based on user feedback.
- Data Dictionaries – help users understand where data comes from and what individual fields represent
- Data Visualizations – provide users with a way to quickly compare specific data points and see aggregates
- Filters – allow users to control the amount and types of data they are engaging with
- Drill Through Reports – create paths for users to see more detail on specific data points
- Analytic Dashboards – present data insights as interactive graphical user interfaces to display, track, and analyze key performance indicators (KPIs)
- Artificial Intelligence – supplies users with a method to ask ad hoc questions and receive nuanced and sophisticated answers from large data sets without the need to engage directly with the data.
Working with Federal government agencies to support user engagement with large data sets, we have learned most users prefer an experience that offers clear insights that allow them to not only act but also to be empowered to manipulate data to discover additional details. At Analytica, data can only be powerful if it is easily used.
About Analytica:
As one of a select group of companies capable of bridging the gap between functional silos, Analytica specializes in providing a holistic approach to an organization’s financial, analytics, and information technology needs. We are an SBA-certified 8(a) small business that supports public-sector civilian, national security, and health missions. We are committed to ensuring quality and consistency in the services and technologies we deliver. We demonstrate this commitment through our appraisal at the Software Engineering Institute’s CMMI® V2.0 Maturity Level 3, ISO 9001:2015, ISO/IEC 20000-1:2018, ISO/IEC 27001:2013, and ITIL certification.
We have been honored as one of the 250 fastest-growing businesses in the U.S. for three consecutive years by Inc. Our ability to succeed and grow is credited to our people and the great work they do. We are an organization that embraces different ideas, perspectives, and people. Every one of us at Analytica offers a unique background and different characteristics that adds to our quality of work and help us better serve our clients. Interested in joining a team that enjoys working together and truly loves what they do? Visit our Careers page to check out employee testimonies, the benefits we offer, and our open positions!
 Justin Bell | 12/27/2024


